Grid information in Eduard
Click on the row of buttons in the lower right window corner or use the View menu (at the top of your screen) to see detailed information about a grid.
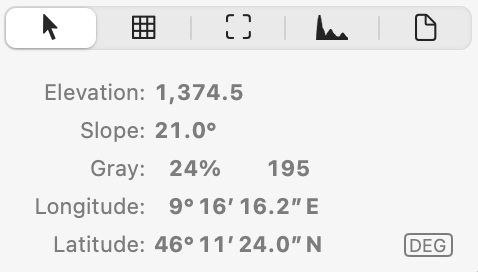
Values at the pointer position
Move the mouse pointer over a location on the shading to see the elevation and slope.
Elevation: The elevation at the pointer location.
Slope: The slope at the pointer location.
Gray: The gray value in percent black and as gray value between 0 and 255.
X or Longitude: The horizontal coordinate.
Y or Latitude: The vertical coordinate.
If the grid has a spatial coordinate reference system, you can click on XY or DEG to switch between projected XY coordinates and spherical degrees coordinates.
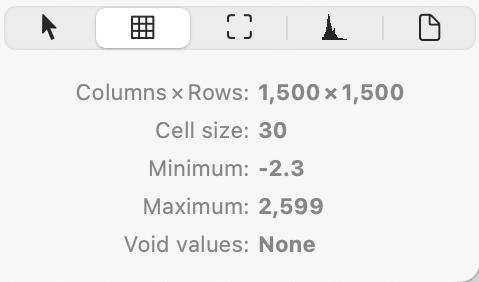
Grid size
Columns × Rows: The number of columns and rows in the grid.
Cell Size: The size of a grid cell.
Minimum: The minimum elevation value in the grid.
Maximum: The maximum elevation value in the grid.
Void Values: The number of void (or no-data) values in the grid.
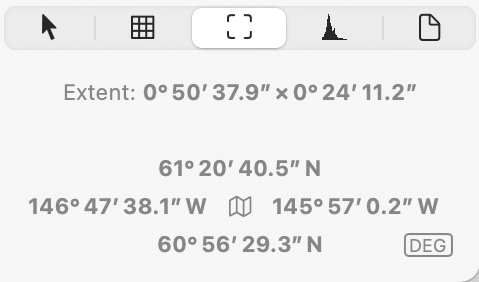
Extent: The width and height of the grid in meters or spherical degrees.
The northern, western, eastern and southern border of the grid.
Click the map icon
 to view the grid area in a
map viewer
.
to view the grid area in a
map viewer
.
If the grid has a spatial coordinate reference system, you can click on XY or DEG to switch between projected XY coordinates and spherical degree coordinates.
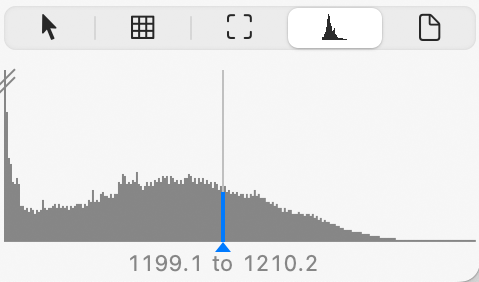
Histogram
Move the mouse pointer over a location on the grid to see its elevation in the histogram.
Below is a typical elevation histogram of an area with a few high peaks. The two oblique parallel lines on the far left of this histogram indicate a histogram peak that has been truncated because it represents a large number of values.
Use the histogram to locate outliers. If a histogram shows a sequence of empty intervals, the grid likely contains outliers, which may result in a poor shading. You can clip outliers to improve the shading.
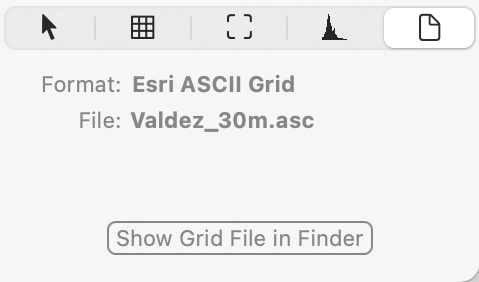
Grid file
Format: The format of the grid file.
File: The name of the grid file.
Click Show Grid File in Finder to see the location of the grid file in Finder.
![]()