Clip elevation values in Eduard
Extreme outlier elevations in a grid result in a poor shading. A histogram of elevation values helps you to identify outliers: If a histogram contains a sequence of empty intervals, the grid likely contains outliers.
Clip outlier elevations
Choose Grid (at the top of your screen) > Clip Elevation Values or click the Clip button in the toolbar.
Then
Drag the left yellow handle to the right to replace small elevation outliers.
Drag the right yellow handle to the left to replace large elevation outliers.
Or click one of the + buttons.
Change threshold values as needed.
Choose how to replace values below or above the threshold values:
If you select Replace with void value, then clipped elevation values are replaced with a special void value encoding void (or no-data) grid cells.
If you do not select Replace with void value, then clipped elevation values are replaced with the threshold value.
Click the - (minus sign) buttons to remove threshold values.
Click Highlight empty histogram intervals to clearly see empty intervals in the histogram.
Click Clip Elevations.
Exporting a grid with clipped elevations
When you export a grid with clipped elevation values to a new grid file, the clipped elevations are exported.
Example 1: Replace small outlier elevations
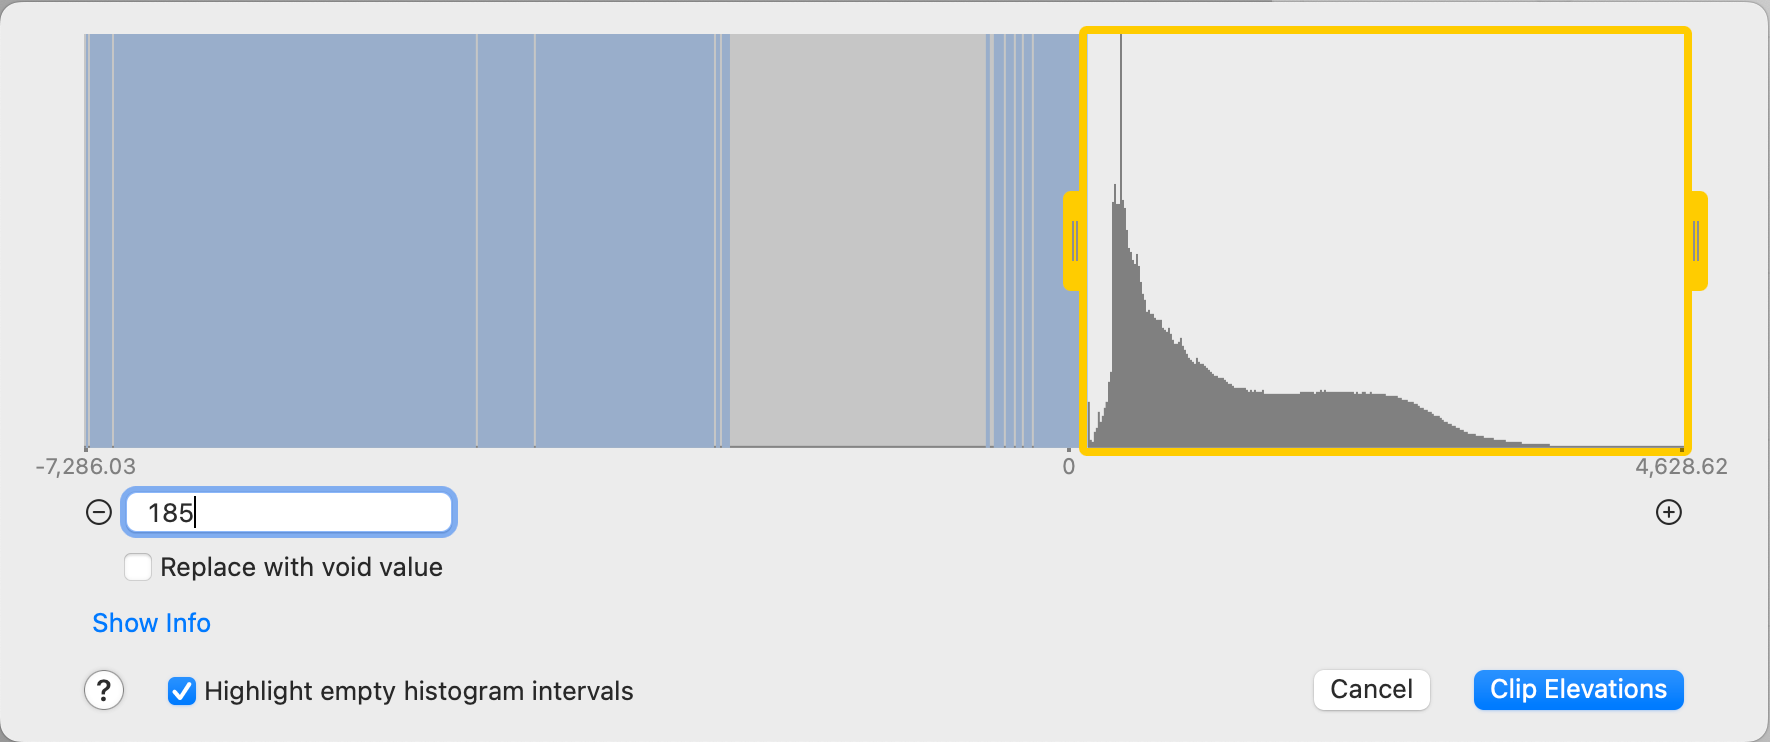
In the example below, the grid contains extreme negative outliers, which result in a poor shading. The smallest outlier is at -7,286.03 m. The histogram shows that valid elevations are between an approximate lower elevation of 185 m and the upper maximum elevation of 4,628.62 m. The histogram contains many empty intervals, which are highlighted in blue. The lower threshold was set to 185 m to replace all outliers smaller than an elevation of 185 with an elevation of 185 m.
Example 2: Replace large outlier elevations
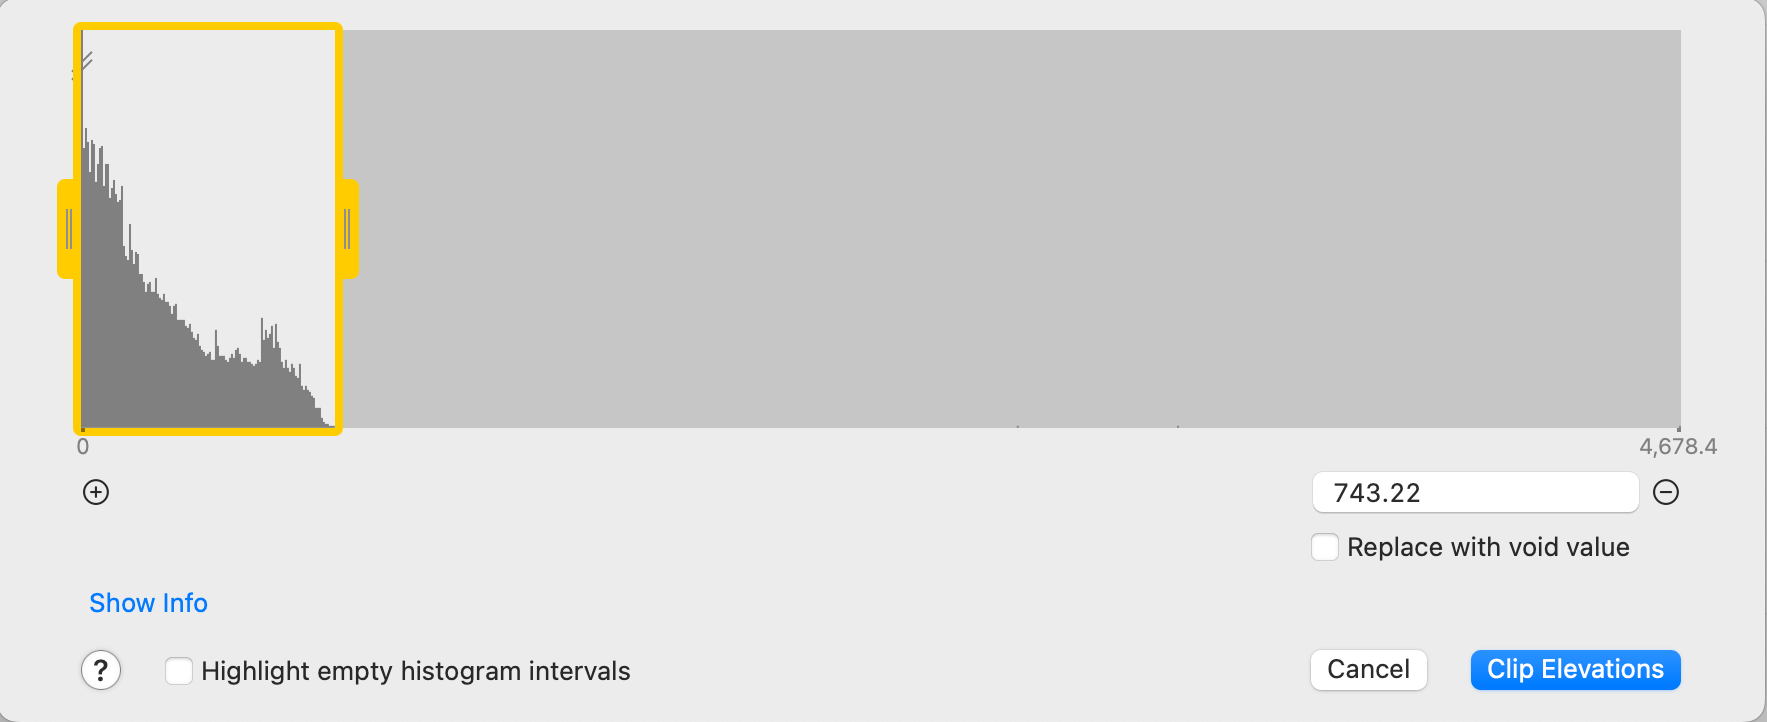
In the example below, the grid contains extreme positive outliers, which also result in a poor shading. The histogram shows that valid elevations are between mean sea level (0 elevation) and approximately 740 m. The upper threshold was set by dragging the right yellow handle to a value of 743.22 m and values greater than this value are replaced with an elevation of 743.22 m.
See also
![]()